To me, breakout trading is one of the best setups and trading strategies.
Every trader’s looking for the perfect setup — the one that’ll increase their odds and make it possible to win most of their trades.
The reality is, there’s no perfect setup. But breakout trading is a great strategy to learn.
The bonus? There’s more than one way to play a breakout, and different types of breakouts present different opportunities.
Keep reading if you want to learn my breakout trading strategies. And apply for the Trading Challenge to go even more in depth. It’s the best trading education on the planet if I do say so myself.
Table of Contents
- 1 So, What Is Breakout Trading?
- 2 Is Breakout Trading Profitable?
- 3 How Do You Find Stocks Before Breakouts?
- 4 How to Implement a Breakout Trading Strategy
- 5 Bonus Tip: Top 2 Breakout Trading Books
- 6 Frequently Asked Questions About Breakout Trading
- 7 Conclusion
So, What Is Breakout Trading?

Let me first define breakouts in general. A breakout is price movement through historical resistance.
For example, InnSuites Hospitality Trust (AMEX: IHT) recently broke through resistance levels that developed as the stock price trended sideways over several months.
Check out the chart to see what I mean:
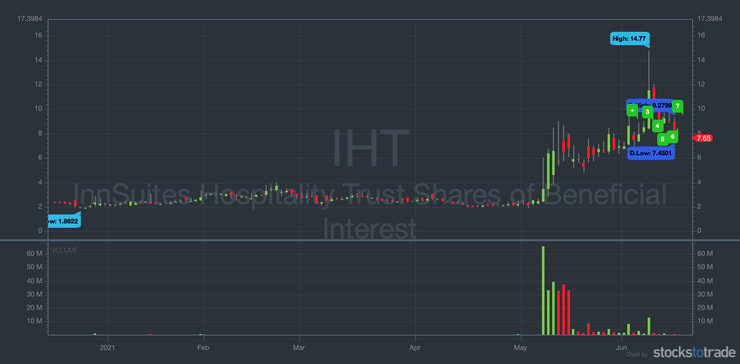
This stock went sideways for several months until it spiked in May. The breakout caused a huge change in the stock’s momentum, and ever since then, the stock has held up nicely.
That’s a breakout in stocks.
Breakout trading is any strategy that takes advantage of the price action as a stock breaks through resistance.
Now, look at the bottom of the chart. Notice the spike in trading volume following the initial breakout? Volume and volatility almost always spike during a breakout.
The obvious strategy is to buy shares on the breakout and then sell for a profit after the price rises. But there are other breakout strategies — and sometimes buying the breakout as it happens isn’t the best strategy.
Read on to find out why. But first, let’s cover some pros and cons of trading breakouts.
Pros of Trading Breakouts
Like most of the patterns I trade, there can be a certain level of predictability when you trade breakouts. That’s what can give prepared traders an edge.
And that’s what’s so great about trading breakouts. They tend to happen consistently enough that if you study hard, you’ll be ready to play them. But remember, there are no guarantees.
So you need to cut your losses quickly if a trade goes against you. It’s rule #1 for a reason.
Cons of Trading Breakouts
Trading breakouts isn’t all sunshine and rainbows. There are plenty of cons as well.
The biggest disadvantage I’ve seen in my 20+ years of trading breakouts is trading halts. They can be common with breakouts and can completely throw off your trade plan.
Trading halts usually occur when a flood of buyers or sellers rush into a stock all at once.
The problem with getting caught in a halt is that you can’t manage risk as easily. When the halt is lifted, the stock might gap down big, and you can instantly lose your hard-earned cash.
That’s why it’s crucial to understand more than just the patterns. You need to study all aspects of the stock market to prepare for anything that might come your way. I think the best way to do that is to study the past.
But so far, I’ve oversimplified things. There’s more to understand with breakouts. Let’s dig in.
More Breaking News
- Top Bitcoin Stocks to Watch Under “Crypto Emperor Trump”
- BigBear.ai’s Journey in the Stock Market: Rising Trends and Challenges
Stock Market vs. Crypto Market Breakout Strategies
Trading cryptocurrency isn’t much different from trading stocks or forex. At least not in terms of breakout strategies. So if you’re into crypto, the breakout strategies we’re talking about here should apply.
But be careful — crypto can have massive swings. I’ve traded some crypto stocks, but I don’t trade the actual currency. I like to focus on stocks. A few of my students are really into crypto trading, applying penny stock patterns to altcoins…
Top Challenge traders Matthew Monaco and Kyle Williams are crushing it in the crypto sector this year.* Now they share their crypto breakout trading knowledge and more in their new program Crypto Rockets. It’s a great way to learn how trading strategies work in the crypto space with two incredible traders.
Now, let’s get back to stocks…
Is Breakout Trading Profitable?
Profitability depends on a lot of factors. So there’s no easy answer to this question.
But to me, it makes sense for newbies to start with breakout trading strategies. When you can consistently trade breakouts and take the meat of the move, you can work to grow your small account.
Breakout trading has been one of the most popular trading strategies for a long time. It can be an easier pattern to react to and trade. Here’s why…
When a stock breaks through historical resistance levels, it shows that buyers are in control. And when buyers are in control, they push the stock price higher.
That’s what can make breakout trading more predictable.
But don’t think that every breakout means a great trading opportunity. Nothing in the stock market is that simple.
Remember, trading isn’t an exact science. Be meticulous and do your due diligence so you’re ready for anything the market throws your way.
How Do You Find Stocks Before Breakouts?

Everyone wants to know how to find stocks before they break out. That’s harder than it seems. Most of the breakouts I trade happen after the stock has already moved big and shown up on my scans.
So I react. I don’t play guessing games.
Newbies don’t want to hear that. But as a trader, that’s something you have to accept. You need to be OK with small gains — they add up over time. If you always go for home runs, you’ll end up striking out more often than not.
Now, with that said, there’s a way that you can look for potential trades before the initial breakout.
Look at former runners and see which ones, if any, have a solid support line just below the recent highs. Not sure what support is? Study up on technical analysis — it’s crucial for day traders and swing traders.
When a former runner has solid support just below its recent highs, it signals that buyers are still fighting for new highs. This allows for a potential swing trade idea as you wait for a new breakout to occur.
If you get in and the stock breaks support instead of resistance, get out fast. Then check what went wrong. Win or lose, learn from every trade. That’s how you can improve your trading strategies.
How to Implement a Breakout Trading Strategy
Let’s look at how to trade breakouts.
Like all the strategies I teach, you need a plan for breakout trading. You should know what you’ll do in every situation before you enter the trade. Going into a trade without a plan is a recipe for failure.
Plan every trade and always stick to your plans.
Risk Management Strategy for Traders
Risk management is critical for all traders — but too many newbies overlook it.
The everyday trading breakout strategy I use includes risk management.
Risk management can help you control losses. Yes, you will lose on some trades. So learn to cut losses quickly and optimize your winning trades.
Risk management also gives you a risk/reward ratio. That’s how you determine whether a potential play is worth the risk based on your needs.
How News Catalysts Affect Breakouts
News catalysts might be the top factor to consider in any breakout trading strategy. For penny stocks and microcaps, news can drive crazy price action.
Pay attention to the news.
I always look for the biggest percent gainers with news catalysts. Those are the stocks that have the potential to run and keep running.
Lucky for us, StocksToTrade has a great add-on feature — Breaking News Chat. It alerts subscribers to hot news with the power to move a stock. Don’t make your trading journey harder than it needs to be. Try StocksToTrade’s Breaking News Chat today to get access to BIG penny stock news fast.*
Benefits of Using Breakout Trading Indicators
I already mentioned that trading volume and volatility often jump after a breakout. If there’s a price spike but no increase in trading volume, do more research. Try to understand what’s driving the price action.
You also want to confirm the breakout. I use candlestick charts, and there are a few candle breakout indicators you can use for confirmation.
Candlestick charts are price action patterns that you can graphically see on a stock chart. They’re the foundation of technical analysis and a crucial part of trading breakouts.
The longer the breakout candle, the stronger the initial move. But don’t necessarily trust the first candle, no matter its length. It could be an unconfirmed breakout, aka a fakeout.
Wait for the next candle to confirm the breakout. You might even wait for the third candle — it depends on the catalyst, the candle period, and your trading plan.
If I plan to wait out the breakout and dip buy a later panic, I’m looking for the overall breakout range. I also look for possible support levels when the stock pulls back after the initial breakout.
The Importance of Chart Patterns
If you read my blog and watch my YouTube videos, you know patterns are crucial in my trading strategy.
I’m more of a history teacher than anything else. What do I mean by that? The same patterns repeat again and again.
That’s what I teach my students. The sooner they learn to spot patterns, the sooner they’re on the road to self-sufficiency. That’s why I’m really just a glorified history teacher.
Examples of Breakout Trading Patterns
Here are a few examples of breakout trading patterns. Study them to get an idea of what to look for as you develop your breakout trading method.
#1 First Green Day Breakout
This is one of my favorite plays. In fact, most of the breakouts I trade are first green day breakouts.
When a penny stock ends the day on a recent high that’s also the daily high, there’s a good chance it will either gap up or continue its rise the next morning. Especially if the stock has a history of doing so.
These breakouts can last three or four days before the stock drops again.
Alfi inc. (NASDAQ: ALF) is a great example of a first green day breakout. Check out the chart…
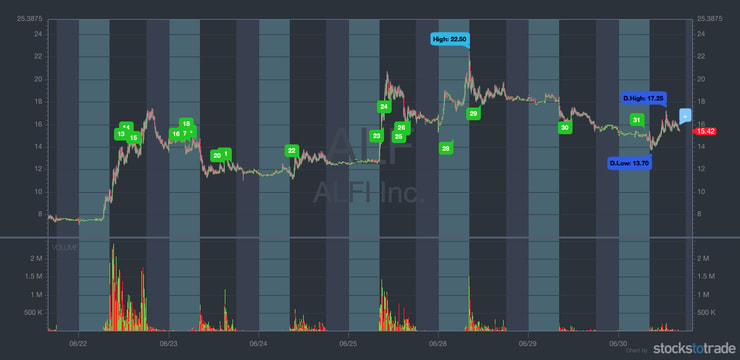
As you can see, this stock had virtually no volume until it spiked huge on June 15. Once the volume came in, the stock started spiking.
This is a great example of a first green day breakout. The stock continued spiking the day after the initial spike.
#2 The Supernova
This is another one of my all-time favorite patterns. Supernovas rule!
The big price jump in a supernova usually indicates an overextension of the price action. In other words, the bulls are on fire buying the stock, so the price goes up too far and too fast. The result? Almost without fail, it ends in a significant price drop.
Depending on your experience, you could play the supernova both long and short. What do I mean by that? Long means you buy low and sell high. Shorting means you borrow shares high, sell them right away, and then buy shares to pay back when the stock price drops (assuming all goes well).
Playing both sides of a supernova move is complex though.
Check out the Green Globe International, Inc. (OTCPK: GGII) chart below…
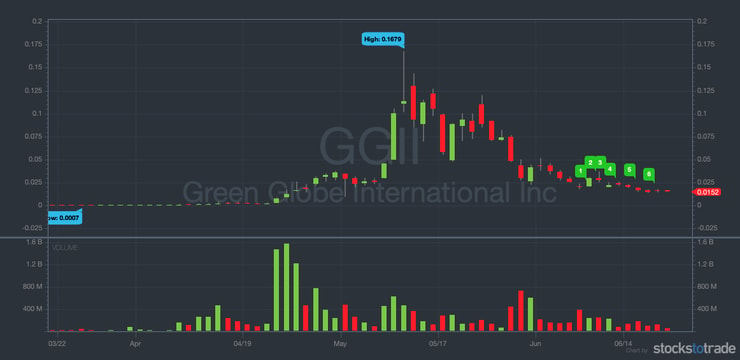
Notice how the stock price goes full-on parabolic then falls hard over the next few weeks? That’s a classic supernova pattern.
Again, it gives you the chance to potentially play both sides — if you’re prepared. Just be extremely careful if you plan on shorting. That’s a dangerous game to play these days.
#3 Flat-Top Breakout
A flat-top breakout is easy to see on a candlestick chart. The price is flat and the stock trades sideways for a while before the breakout.
The sideways trading period can also be a period of consolidation after a previous breakout.
Here’s an example of a flat-top breakout on AMC Entertainment Holdings, Inc. (NYSE: AMC). Look at the six-month chart…
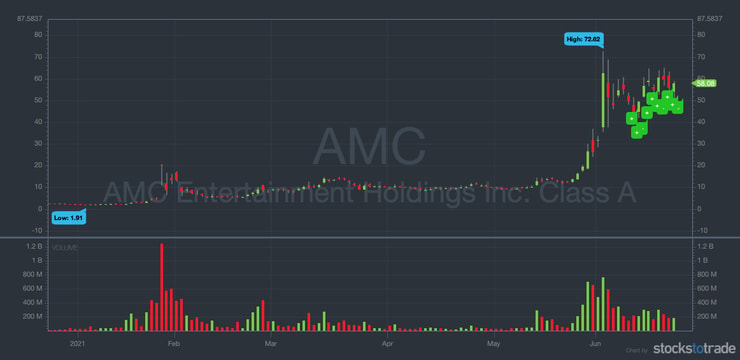
After the first breakout in late January, the stock started to consolidate around $14 per share. It stayed there for three or four months before breaking out again. This is a great example of a flat-top breakout.
Look closely and you can see the second breakout is another great example of a first green day breakout. Not all breakouts follow just one breakout trading pattern. Know to look for those that follow two or more.
Generally, the more breakout trading patterns a stock follows, the better likelihood of a solid breakout. This isn’t always the case, though. Trading isn’t an exact science.
#4 Triangle, Wedge, and Flag Breakouts
I lumped these together because they’re variations of the same thing — a continuation pattern. The triangle, wedge, or flag is a period of consolidation after a rise in price. One consolidation breakout strategy is to wait for confirmation before opening a position.
As the consolidation period goes on, the highs and lows either move within a parallel channel or converge. This forms the triangle, wedge, or flag shape. After the consolidation comes the continuation. Sometimes it’s gradual, and other times it’s a clean breakout.
Take a look at the chart for Torchlight Energy Resources, Inc. (NASDAQ: TRCH)…
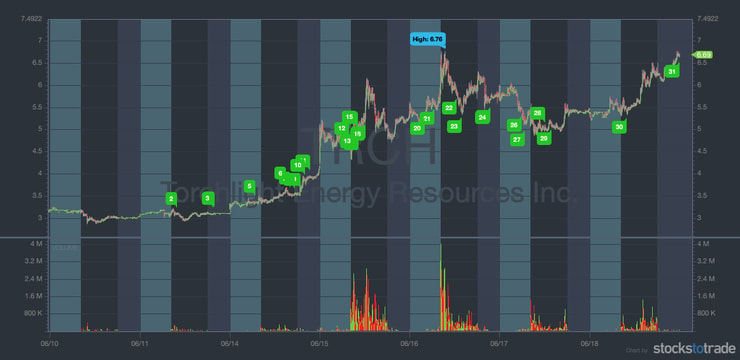
If you look closely, you can see the price action consolidating after almost every breakout. This can be a great indicator. It gives you the chance to enter before a stock breaks out again.
Note: This stock recently merged with Meta Materials Inc. (NASDAQ: MMAT) and now trades under that ticker. But you can still study this chart to help you learn to spot breakouts before they happen.
The Trading Challenge
Want to be a self-sufficient trader? You need to study up.
Apply to join the Trading Challenge if you’re serious about trading. You’ll get access to all my video lessons, live webinars, and one of the best trading chat communities on the planet. Plus you’ll get my watchlists, breakdowns of the trades my top students and I make, and MUCH more.
But I don’t accept everyone … You must be willing to put in the time and do the work. Apply today to find out if you make the cut.
Bonus Tip: Top 2 Breakout Trading Books

There are many books that can help you learn breakout trading strategies. Here are a couple of my favorites that can give you a headstart in your studies…
1. “The Complete Penny Stock Course”
My student Jamil wrote this book to compile all of the lessons I’ve learned in my 20+ years of trading. He designed the book to help traders of all levels improve their trading knowledge, techniques. and strategies.
I think it’s particularly useful when it comes to breakout trading.
Plus, the book is organized to help you better understand the stock market as a whole, the psychology behind trading, risk management techniques, and how to spot different patterns.
I think all traders should own this book and refer to it often. Get your copy of “The Complete Penny Stock Course” today!
2. “An American Hedge Fund”
This book is about my life as a trader. It goes over what pushed me to start trading and how I mastered my skills.
Even though it doesn’t give you exact strategies for breakout trading, it can help you develop the proper trading mindset for this niche.
Mindset is critical for all traders. No matter how skilled you are at spotting patterns and timing entry and exit points, you won’t succeed without a determination to push harder and harder.
Best of all, you can get a copy for no cost! Grab your copy of “An American Hedge Fund” today.
Frequently Asked Questions About Breakout Trading
OK, one more question and answer…
When Do You Buy Breakouts?
Most traders think you can only buy breakouts as a stock breaks through resistance levels. That’s not necessarily always the case. Depending on the play, you can buy breakouts before the stock breaks out, as it breaks out, or even after the breakout is confirmed. That’s why you need to study hard and be ready for anything.
Conclusion
I think breakout trading is great for traders of all levels.
And the best way to learn to spot breakouts is by studying the past and getting lots of screen time. History doesn’t repeat itself, but it rhymes. So studying the past can help you prepare for the future.
Most importantly, make sure you always plan your trades. Know your entry and exit points in advance. Know the catalyst and the psychology of the trade.
Then you have to stick to your plans. And you won’t be right all the time, so learn to cut your losses quickly.
What’s your experience with breakout trading? Comment below and tell me what you think!
*I have a minority ownership stake in StockstoTrade.com.







Leave a reply