Did you know that most of my millionaire students started with less than $10,000?
- Jack Schwarze started with $2,000 in 2016. He crossed the $1 million mark in February 2021.
- Jack Kellogg turned $7,500 into +$10 million.
- Kyle Williams built up +$3,600,000 from a tiny $6,000 account.
Wheww, what a year, right?!? How’d you end up? How cool it is that several of my top https://t.co/occ8wKmT5U students are now getting featured in the press as it’s not just me who’s turned a few thousand into a few million, I now have 30+ millionaire students & several more soon! pic.twitter.com/U6iFbi6oUi
— Timothy Sykes (@timothysykes) December 30, 2022
Small accounts are my specialty.
I love teaching MILLIONAIRE CHALLENGE students how to take just a few thousand dollars and turn it into REAL WEALTH.
My students learn specific patterns that offer repeatable setups year after year.
And the absolute BEST place to start is the multi-day runner.
Plus, they work great with my bread and butter setups, including the morning panic dip buy.
However, many traders struggle to identify and trade the right runners.
This YouTube video I made 2017 highlights key differences between two stocks that were popular at the time.
But I want to take this to the next level and give you a breakout blueprint that anyone can use…
And it involves three easy steps.
1. Find Multi-Day/Week Runners in Consolidation
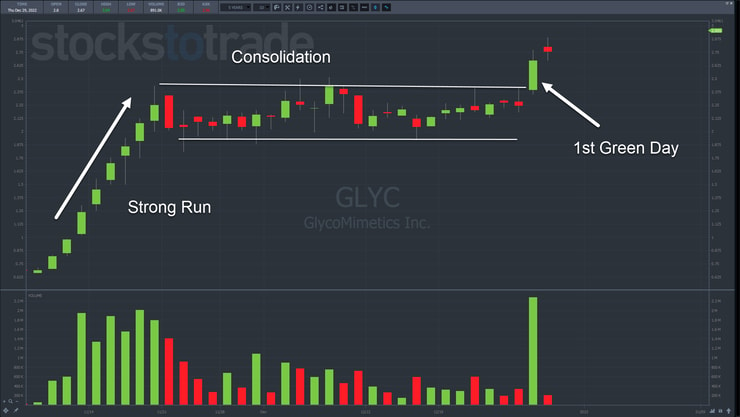
Yesterday’s blog post contained the following chart for GlycoMimetics Inc. (NASDAQ:GLYC):
This is a perfect example of the multi-day/week runners we want.
Look for a stock that’s had a nice run on heavy volume that moved into a consolidation pattern.
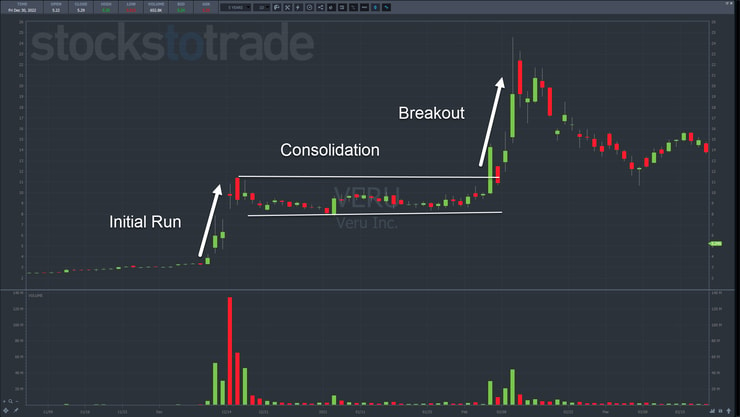
Here’s another example in Veru Inc. (NASDAQ: VERU):
The idea is to find a stock that pushes higher off a clear news catalyst and maintains its gains.
Over time, short sellers build up on higher priced stocks, while breakout traders jump on when they see the stock move without them, especially when promoters are involved.
While there’s nuance to this pattern, keep it simple and stick with ones that hold near the highs and even test breakouts a few times.
2. Choose Your Setup
In this video, I explain what a first green day looks like.
This setup works especially well with OTC stocks and is great for traders who don’t have a lot of time.
Don’t give overnight trades like these tons of wiggle room.
You want to see them gap up the following day and keep going.
If that doesn’t happen, don’t be afraid to cut the trade quickly for a small loss.
The last thing you want to do is buy a fakeout and get pulled down with the stock.
Once you’ve got a first green day, then you can start to look for morning panic dip buy opportunities.
These typically occur in the first 15-30 minutes of the trading day.
Practice morning dip buys with a simulated account or very small amounts of capital until you get comfortable reading level 2 data and price action.
Most traders do better when they wait for a stock to show a bottom before stepping in.
That way, they have a low to trade against.
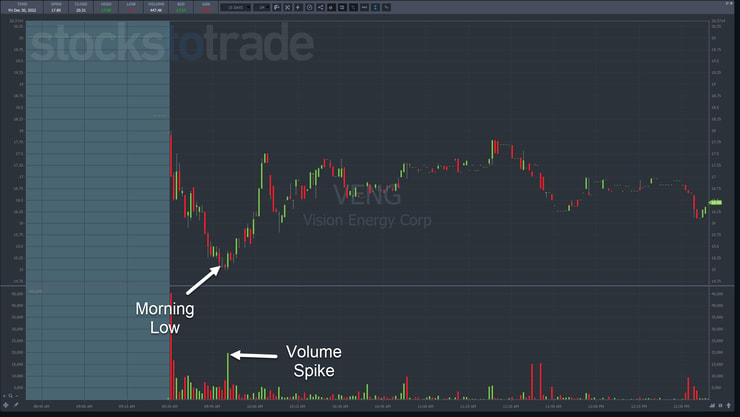
Here’s an example with Vision Energy Corp. (OTC: VENG):
VENG took two tries to make a low.
Typically, I prefer a second low to the first.
Nonetheless, a new trader could wait until you saw confirmation of a bottom through a volume spike and bounce that happened off the round $15.00 level.
From there, you can go long at, say, $15.50-$15.75 with a stop at the $15.00 low.
More Breaking News
- DatChat Inc.’s Stock Skyrockets after Major Direct Offering: What’s Next?
- Phio Pharmaceuticals’ Stock Skyrockets: Is the Surge Here to Stay?
- Rise or Fall: Is Nature’s Miracle New Acquisition a Game Changer?
The more you practice the better your entries and overall performance.
3. Know Thy Framework
Be aware that this type of price action is typically moving from phase 2 to phase 3 in the 7-Step Penny Stock Framework.
That means the stock is likely closing in on its peak sooner rather than later.
So, keep these trades short and sweet.
Don’t push too hard or you risk getting sucked into the inevitable downdraft.
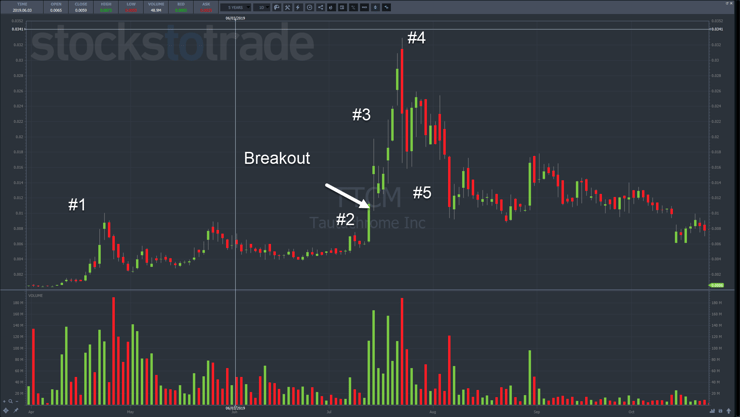
Using the example from the YouTube video, Tautachrome Inc. (OTC: TTCM) used that breakout to drive up another 200%.
However, it doesn’t always work out that way.
Sometimes, we see fakeouts or complete collapses within days.
That’s why it’s so important to trade cautiously.
Making money is hard. But keeping it is even harder.
—Tim



Leave a reply