You know me — I love patterns. Do you know the ascending triangle pattern?
Some patterns are more advanced and require more expertise to spot … Others are simpler and more newbie-friendly.
I have my go-to patterns, like the supernova and the cup and handle. I’ve developed strategies that work for me.
My students have taken the time to find patterns and develop strategies that work for them. Like Jack Kellogg who’s now up over $750K* … Learn more about him and other top Challenge students in this recent New York Post article.

When you’re first starting out, you gotta expose yourself to as many patterns and as much knowledge as possible.
If you’re looking for a simple bullish pattern, the ascending triangle pattern is one worth knowing.
Let’s go over what the ascending triangle pattern is, how it works, and how to find it in play…
(*Please note: My trading results, along with the results of my top students, are far from typical. Individual results will vary. Most traders lose money. My top students and I have the benefit of many years of hard work and dedication. Trading is inherently risky. Do your due diligence and never risk more than you can afford to lose.)
Table of Contents
- 1 What Is an Ascending Triangle Pattern?
- 2 How Does the Ascending Triangle Pattern Work?
- 3 Understanding the Difference Between an Ascending Triangle and a Descending Triangle
- 4 What Is a Symmetrical Triangle Pattern?
- 5 Ascending Triangle vs. Rising Wedge: What’s the Difference?
- 6 What Are the Advantages of the Ascending Triangle Pattern?
- 7 What Are the Limitations of the Ascending Triangle Pattern?
- 8 Example of How to Interpret the Ascending Triangle Pattern
- 9 How Do You Trade Ascending Triangles? Pro Tips
- 10 Conclusion
What Is an Ascending Triangle Pattern?
The ascending triangle pattern is considered a bullish pattern.
I’m sure you’ve heard of ‘bulls’ and ‘bears’ in the stock market. These are the two main ways to describe whether a stock is going up or down.
Bullish means the stock price looks like it should move higher — that’s what the ascending triangle pattern indicates.
The best part? You can apply this pattern — like other patterns in the stock market — to different time frames. Whether you’re looking at a daily chart or an intraday chart, it’s still a bullish pattern.
Whether you’re looking for an intraday or a swing trade based on a daily ascending triangle, the same principles apply. I don’t usually swing trade, so I mainly look for this pattern intraday.
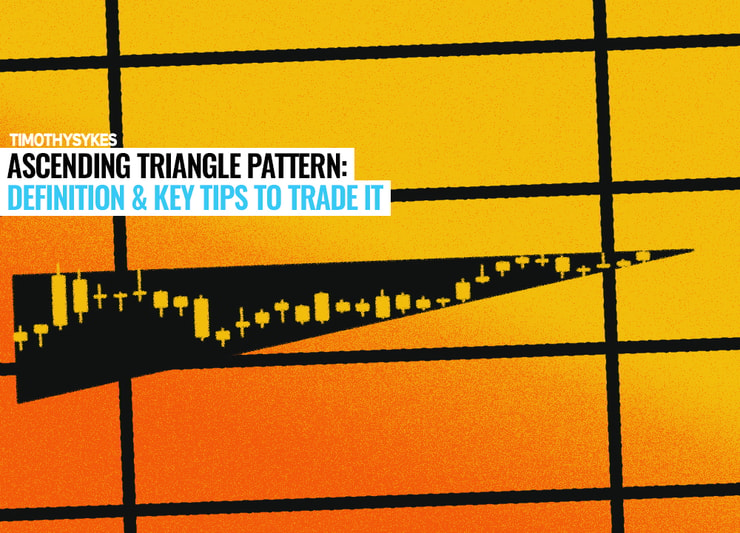
Before I go on, here’s what an ascending triangle pattern looks like on a stock chart:

See how the chart forms a triangle, where the top is flat but the bottom keeps rising? And notice that as soon as the stock breaks above that triangle, the price continues upward.
This is a continuation pattern, where the stock price continues in the direction of the breakout after it breaks out of the channel.
How Does the Ascending Triangle Pattern Work?
The ascending triangle pattern, like other patterns, shows the emotions of traders trading the stock.
Look at PEIX. Every time the stock dips, each low is progressively higher than the last. This means buyers generally feel comfortable and are buying the stock on dips.
And the sellers don’t come in until the top of the ascending triangle. This signals that buyers are likely in control of the stock. Also, take note of the volume candles on the PEIX chart.
Every time it went near the high of the triangle, volume increased. This can be a signal that buyers want the stock to go higher.
But notice the period where the stock finally broke out of the triangle. There was even more volume than the previous test.
This is almost always needed for the stock to break out of the ascending triangle. If you see a stock breaking out of an ascending triangle with little volume coming in … be careful.
Not sure how volume affects stocks? Watch this video:
This pattern works when buyers are in control. Once sellers give up, the buyers step in and move the price of the stock up. Can you see it on the chart?
No two ascending triangle patterns will be identical. Let’s talk about how to identify one…
How to Identify an Ascending Triangle Pattern
For the most part, ascending triangle patterns are very similar. They come in different forms, but they have the same characteristics:
- A clear and defined top
- Higher lows
- Increasing volume at the highs
Ascending is a synonym for ‘rising.’ Think of this as a rising triangle. It looks like the name of the pattern — an ascending triangle.
Here’s something to remember: the top of the triangle should always be flat. This is known as an area of resistance.
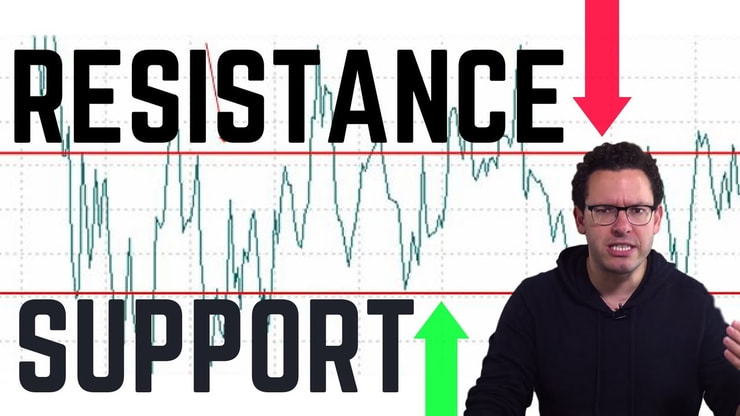
Resistance is one of the simplest technical indicators out there. It’s a spot where sellers try to keep a stock down. Once resistance is broken, the stock should have room to move higher.
The PEIX example is good, but to understand this pattern you need to see it on multiple charts. Here’s an example from a recent runner, Ocugen, Inc. (NASDAQ: OCGN):

The pattern might be harder to spot on this chart — it’s a tighter triangle with less range.
Look how high OCGN went after breaking the top of the triangle … from 57 cents per share to 66 cents per share. That’s about a 16% move.
Again, remember that the ascending triangle should form higher lows as it tests a clear level of resistance. Once it breaks through, it confirms the movement to the upside.
Understanding the Difference Between an Ascending Triangle and a Descending Triangle
What goes up must come down.
The ascending triangle pattern has a bearish counterpart: the descending triangle pattern.
Know the difference so you don’t get caught in the wrong play.
The descending triangle is like an upside-down flip of the ascending triangle. Instead of making higher lows while testing an area of resistance, a descending triangle makes lower highs while testing an area of support. (Support is the opposite of resistance, BTW.)
This means the flat part of the triangle is on the bottom, while the other line is declining.
In this scenario, the sellers are in control … usually selling into pops. Once the support gives out, the stock should continue to fall to the downside.
What Is a Symmetrical Triangle Pattern?
Generally speaking, ascending triangles are bullish, while descending triangles are bearish.
But there’s another triangle pattern that’s neither bullish nor bearish … at least, until it chooses a direction out of the trend. It’s called the symmetrical triangle pattern.
Here’s an example from Amazon.com, Inc. (NASDAQ: AMZN):

Right out of the open, Amazon began forming a triangle, but there wasn’t a clear direction. It didn’t test a particular top, but it also didn’t test a solidified bottom either. Instead, it made lower highs and higher lows.
With a symmetrical triangle pattern, there’s no telling the stock’s direction until it breaks out of the trend.
If it breaks downward out of the triangle, it’s considered bearish. If it breaks upward out of the triangle, consider it bullish.
I don’t like the symmetrical triangle as much. There’s no telling who’s really in control like with the ascending or descending triangle.
One more thing…
There’s also another commonly confused pattern that lots of traders think is a triangle, but it’s not — it’s the rising wedge.
Ascending Triangle vs. Rising Wedge: What’s the Difference?
The rising wedge is another pattern that isn’t necessarily bullish or bearish but makes a triangle-like formation that can be confusing to newer traders.
Here’s an example of it on a daily chart of Amazon:

In this case, the pattern eventually turned out to be bullish, leading to upward momentum after it broke out of the rising wedge. Had it broken down instead, it probably would have continued with downward action.
The main difference here is that the ascending wedge pattern makes a clear flat top where there’s resistance. As it continues to form, higher lows should form the ascending triangle pattern.
Once enough buyers and volume come in, the top should be taken out and the stock should continue up.
With a rising wedge, there’s not one clear price level where the stock struggles to break out. That’s why I wouldn’t recommend a brand-new trader try to learn this pattern first.
Keep it simple. Learn the easy patterns first. Once you find consistency with the basics, start expanding. It can help you stay more focused when you’re building your knowledge account.
What Are the Advantages of the Ascending Triangle Pattern?
I’ve been trading for a long time, so I mostly stick with my go-to patterns…
That said, the ascending triangle pattern has some advantages for new traders.
First, it’s a long-biased pattern. That’s good because a lot of new traders can’t pursue short selling because of broker restrictions…
he started tracking everything. He figured out what was working for him. As it turns out, it was only two patterns. He’d tried Short selling isn’t really smart for new traders, anyway. I’ve been trading for 20+ years and I’m scared to short these days. In the current volatile market with short squeezes left and right, it can be really dangerous.
But I’d say that an even bigger advantage of the ascending triangle pattern is that it’s so easy to spot. The level of resistance should be extremely clear — even to a new trader.
Because of its steady ascent, the ascending triangle pattern offers multiple spots for an entry. If you want to buy it as it breaks out of resistance to catch a potentially faster and safer trade, you can.
If you want to buy on a dip, you can do that too — but know it might be slightly riskier. You might make more on the trade, but you also have less confirmation that it’ll test the area of resistance again.
What Are the Limitations of the Ascending Triangle Pattern?
The main limitation is that it doesn’t always work.
No pattern works every time … If it did, I’d have a better win rate. I’m wrong about 25% of the time … Take a look at a recent example from iBio Inc. (NYSE: IBIO):

On this ticker, $5.05 was the breakout level for the ascending triangle. After breaking out on good volume — at the time — it failed to continue. Then it dumped almost $1 per share.
This is where cutting losses quickly is so important. If a trade doesn’t work, get out immediately.
The last thing I’d want is for you to get stuck in a massive move down and lose. Especially in a case like this, where the stock should have continued up much higher than it went.
Example of How to Interpret the Ascending Triangle Pattern
Interpreting the ascending triangle pattern is straightforward.
You’re looking for are a solid resistance level combined with higher lows. It should form a pretty clear triangle.
But always make sure there’s enough volume coming in on the breakout. The more times the stock tests the top of the triangle, the more volume it needs to break out. If it doesn’t have enough volume, it probably won’t work.
Just look at IBIO. Not enough buyers were coming into the trade, and that eventually led to a massive sell-off. Volume, combined with the triangle itself, should be one of your top watches when looking for the ascending triangle.
How Do You Trade Ascending Triangles? Pro Tips
There are a few different ways to trade the ascending triangle pattern … let’s take a look.
Ascending Triangle Pattern Trading Strategy
There are two main strategies when trading the ascending triangle — each has its advantages and disadvantages.
The first and easiest way is to buy the breakout over resistance.
If you watch closely, you can see the volume coming in over the breakout level. And in combination with the higher lows, this should give you the confirmation you need to take a trade.
Another strategy is to buy the dip. Remember, the dips should hold a triangle-like pattern, so it should be easy to guess where the next dip will be. The issue here is that there’s no confirmation the pattern will work yet. It should hold the trend, there’s always the possibility for failure.
This might be a little more advanced, and it requires quick reactions to cut losses when you’re wrong. But the potential gains could be higher with this strategy.
More Breaking News
- BigBear.ai Expands Partnerships and Strengthens Financial Position
- Valterra Platinum’s Q4 Forecast Drives Anticipation Amidst Earnings Surge
- Ichor Holdings Upgrade Boosts Stock Amid Strong Earnings
- MNTS Stock Surges Amid Strategic Expansion and Financial Insights
Ascending Triangle Pattern Screener
There’s no way to scan specifically for a pattern like this. But a scanner can help you narrow down the many choices of stocks to trade. It’s a smart way to build a smaller and more manageable watchlist. From there, you can monitor your watchlist for patterns like this.
StocksToTrade has an amazing screener to find the hottest plays of the day and the top percent gainers. I use this screener every day to find my plays, and I think you should be too.
Why is finding the top percent gainers important? Because the same stock can go through a lot of different patterns on the same day.
So look for the top percent gainers. The top percent gainers of the day have a lot of strength behind them, meaning ascending triangles that fit that criteria could create great long opportunities.
Once you find the hottest stocks of the day, track the charts and watch for the pattern. Once you see it, you can trade one of the strategies I talked about earlier.
Conclusion
Let’s do a quick recap on ascending triangles…
Here’s what to look for with the ascending triangle pattern:
- Resistance at the top of the triangle
- Higher lows as the triangle ascends
- High volume through the breakout of the triangle
If you can focus these, you might be surprised by how often this pattern shows up. But remember: no pattern works 100% of the time. If the trade starts to go against you, cut losses quickly and protect your account.
The ascending triangle pattern is just one pattern of many worth learning. You won’t get it overnight. It’s OK. Learning takes time — it’s part of the process of trial and error and finding the strategies that work for you.
Knowledge is the key to figuring it out.
Two Ways to Grow Your Knowledge Account
All of my top students studied my educational DVDs, webinars, and video lessons over and over until they finally got it. I don’t have time for students who don’t want to work for success…
Are you willing to be dedicated … even if it means studying for hours a day for months and maybe even years? That’s what it takes. Ask my top students. The discipline and commitment is real. If you’re ready, apply to my Trading Challenge.
Or start with a crash course in trading with my brand-new 30-Day Bootcamp. I filmed this with my student Matthew Monaco, who just passed $250K in profits.* Matt just became a moderator in my Trading Challenge chat room too…
FYI I’m giving a free webinar tonight here https://t.co/qJtLXeIz6O with @StocksToTrade and @tbohen right after my weekly Q&&A webinar for https://t.co/EcfUM6l2S3 students & please give props again to challenge student @mono_trader who passed $250k in profits today on $XTRM whew! pic.twitter.com/STrYZf0yPd
— Timothy Sykes (@timothysykes) August 5, 2020
The 30-Day Bootcamp guides you through basic to advanced trading techniques, with workbooks, video lessons, and more. I’m super excited about it … It’s an awesome way to get a strong trading foundation fast.
Have you ever traded the ascending triangle pattern? Let me know in the comments below!


Leave a reply