Learning to read a stock chart is one of the first steps in becoming my next millionaire trading challenge student as price action is key for traders. Charts are full of useful information and provide many of the necessary data points to determine trends and make inferences about future price movements, but also please see this free penny stock guide for more indicators to use.
As always, there is more than meets the eye and history doesn’t always guarantee the future, so it’s important to understand stock charts, their strengths and limitations.
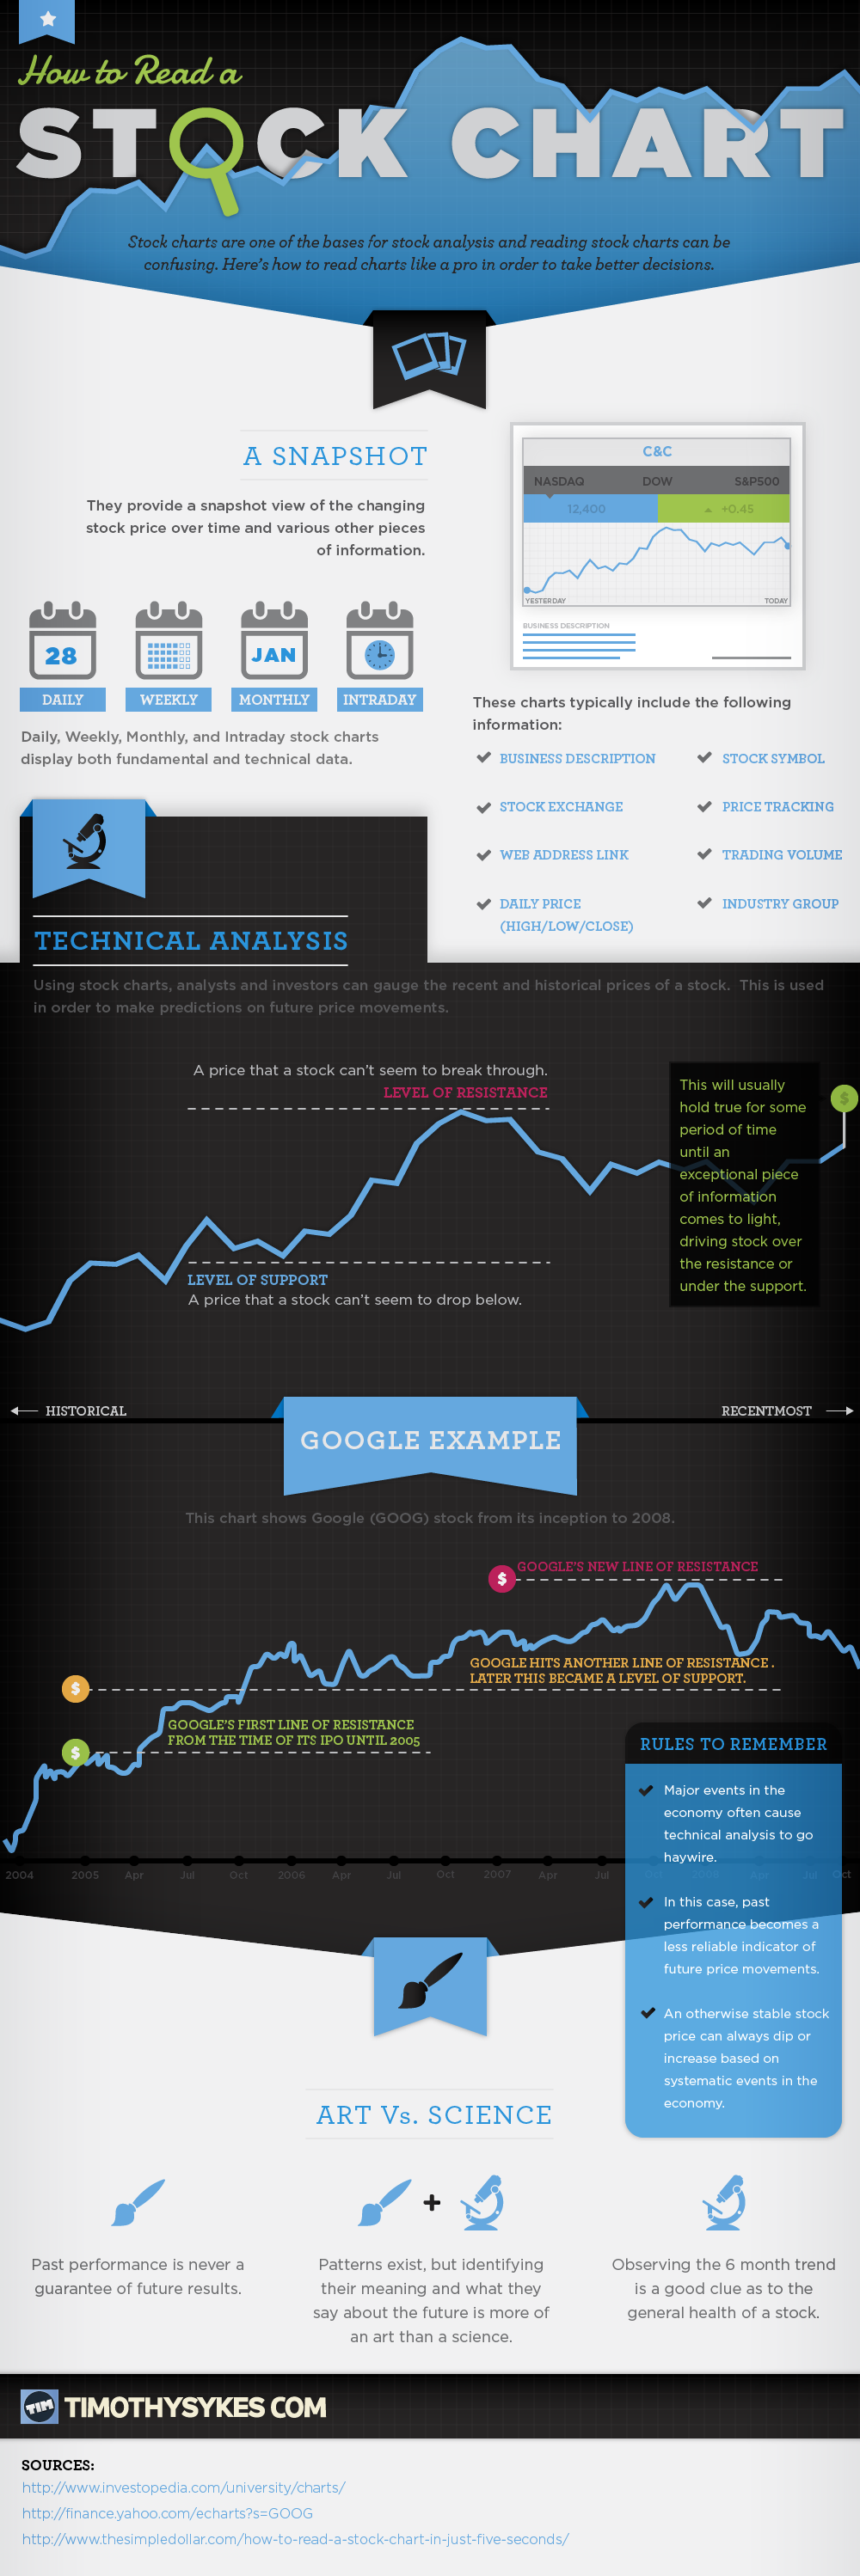
I created this infographic to demonstrate the parts and uses of stock charts.
Click the image below to view
Conclusion:
Stock charts provide us with a visual understanding of price movements over daily, weekly, monthly and yearly periods. Building a foundation of knowledge is important before you invest. Developing your understanding of stock charts is an excellent first step. Remember that investing always involves risk and past price movements do not necessarily dictate the future.


![Image for How Pros Trade Penny Stocks [Infographic] recomended post](https://content.timothysykes.com/cdn-cgi/image/quality=80,format=webp,width=172/https://content.timothysykes.com/wp-content/uploads/2018/05/Screen-Shot-2018-05-05-at-11.58.34-AM.png)
![Image for The Top Performing Mutual Funds [Infographic] recomended post](https://content.timothysykes.com/cdn-cgi/image/quality=80,format=webp,width=172/https://content.timothysykes.com/wp-content/uploads/2017/05/Screen-Shot-2017-08-28-at-12.05.58-PM.png)


Leave a reply